Stephen has tasked us all with creating a graph of some sort for #el30 this week. Questions that came into my mind were:
- What are the parameters?
- How do they interact?
- How can I make visible the potentials?
I’m thinking of learning and what’s visible, what we bring, resources, and what is ideal to implement in each of our situations. I began with things I know (or have seen) and the examples of music and astronomy guided me to an image.
- In music each instrument’s sound has a particular harmonic envelope – very roughly, imagine that there is a rainbow inside each musical note, and depending on what instrument you play, certain colours are brighter and more prominent in your spectrograph. Some instruments seem to be missing colours and others show certain preferences for one area of the rainbow. In musical terms it’s what gives different instruments their timbre. We don’t see this, and more oddly we perceive it in totally different terms- usually in terms of light and dark instead of sonic terms.
- The idea of what isn’t seen but is essential and can be measured through a different lens can also be demonstrated with the sun. This article The Lights of the Sun explains it in an understandable way and they use the video below to demonstrate (quite clearly) how the lens and spin (oh wittiness) matter and show a very different picture.
So how do those lead to a graph for #el30?
I want to somehow show the engagement with the threads that we aren’t quite sure about. I would venture to say that none of us is expert in all the topics, yet we still give it a go.
Here’s my visualisation so far (Image CC BY-NC-SA by [Jim]):

The threads are all different colours, as is our knowledge, expertise, and experience. We have all communicated, making the threads visible, and worked to ‘put them out there’ – but of course, there is no ‘there’ and so the pins are in different places, but approximate toward a ‘hub’ (of the course). However, the central hub is not either a specific place or shape, in fact it is fluid.
The above image is one view.
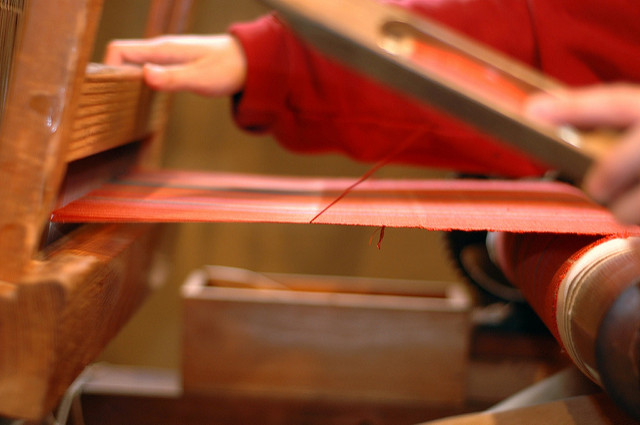
Another view of my graph idea could be this (Image CC BY-NC-ND by Cheryl):
 Although at the moment our interactions may not appear unified or even cohesive. There are aspects of our development, our progress, of the connections made (and making) that show we are knitting (or in this case crocheting) experiences and knowledge to create something that can and will be useful.
I don’t have a graph with data points, but more of a concept and components. I’m not really sure what each of our specific contents are, but knowing people are willing to engage and make their colours visible is a good start.
Pingback: #el30 Notes on the web chat: Ben Werdmuller & Stephen Downes - lauraritchie.com
Hi Laura
I love the photo of the threads and pins. It makes me think of edges and nodes and they form a ‘course’ like a river. I’ve been thinking about what a ‘course’ is, since I first raised the question in one of Jesse Stommel’s Critical Digital Pedagogy classes two years ago.
Laura,
I really loved your take on graphs in your post. The visual metaphor is very powerful
Thank you Gerald. Thanks for taking the time to reply 🙂